The Balloon and the Planet: Running a Fluid Medium Against the Clocks and the Light
23 September 2026
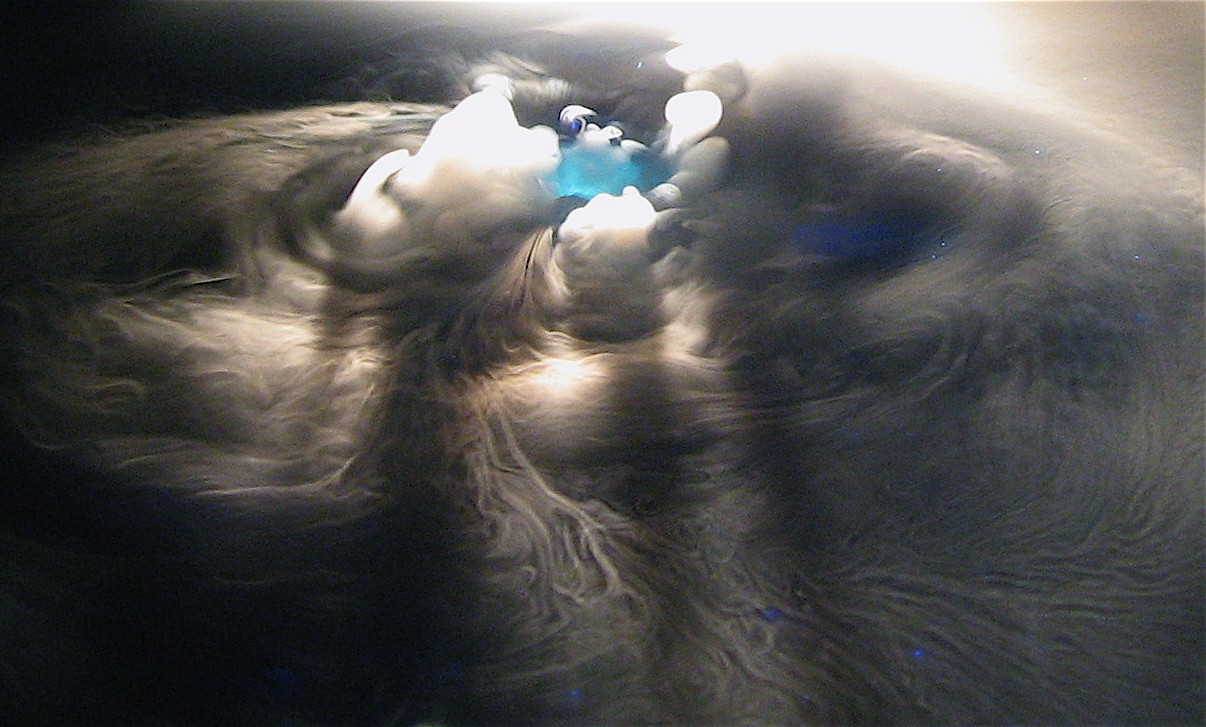 A pellet of dry ice skating on water, its fog wrapping into spirals. Photo: Steve Jurvetson, via Wikimedia Commons, CC BY 2.0; unaltered.
A post went round X this week that I would have written myself a few years ago. It opens with a clip of dry-ice pellets skating across a dish of water and spinning the fog into spirals, sets that beside a cyclone seen from orbit, and says the two are governed by the same fluid dynamics. Then it makes the jump: gravity itself is a force from a superfluid of particles far below the quark scale, permeating everything, and it all comes down to Navier-Stokes and Bernoulli. “Liquid gravity.” In the replies the author adds the school demonstration of two balloons drawn together when you blow air between them, and links a short 2025 write-up in which superfluid vortices are said to reproduce the precession of three planets’ orbits to within a few arcseconds.
This site has argued for a real medium under gravity since its first paper, so I read the post as a cousin, and I want to check it the way I would want my own work checked. Three claims are in it. One is right and proves less than it seems to. One is a real effect pointed in the wrong direction. One is a set of numbers that do not match the published values. And the part of the argument the post never reaches, what one specific fluid medium does when you fit it to the clock measurements and then ask it about light, is a calculation this site has already run. That calculation does not settle whether a fluid can cause gravity; it settles something narrower and, I think, more useful, and that is where this ends up.
What the clip shows
The demonstration is Icy Bodies, an exhibit by Shawn Lani created in 2001 for the Exploratorium and since installed in more than a dozen museums. Chunks of dry ice drop onto a shallow layer of water. Each one sublimates, and in Lani’s own description the carbon dioxide it gives off propels the spinning shards in unexpected directions, while the cold gas condenses the water vapour above into a visible fog that traces the flow. The exhibit was made to evoke comets, and the likeness is the tail: a body that outgasses as it warms and leaves a visible trail behind it.
The cyclone in the post’s comparison is also a real spiral, and the post’s description of it is fair: warm moist air rises over a tropical ocean, cooler air flows in beneath, and the Earth’s rotation, through the Coriolis effect, twists that inflow into a vortex hundreds of miles across.
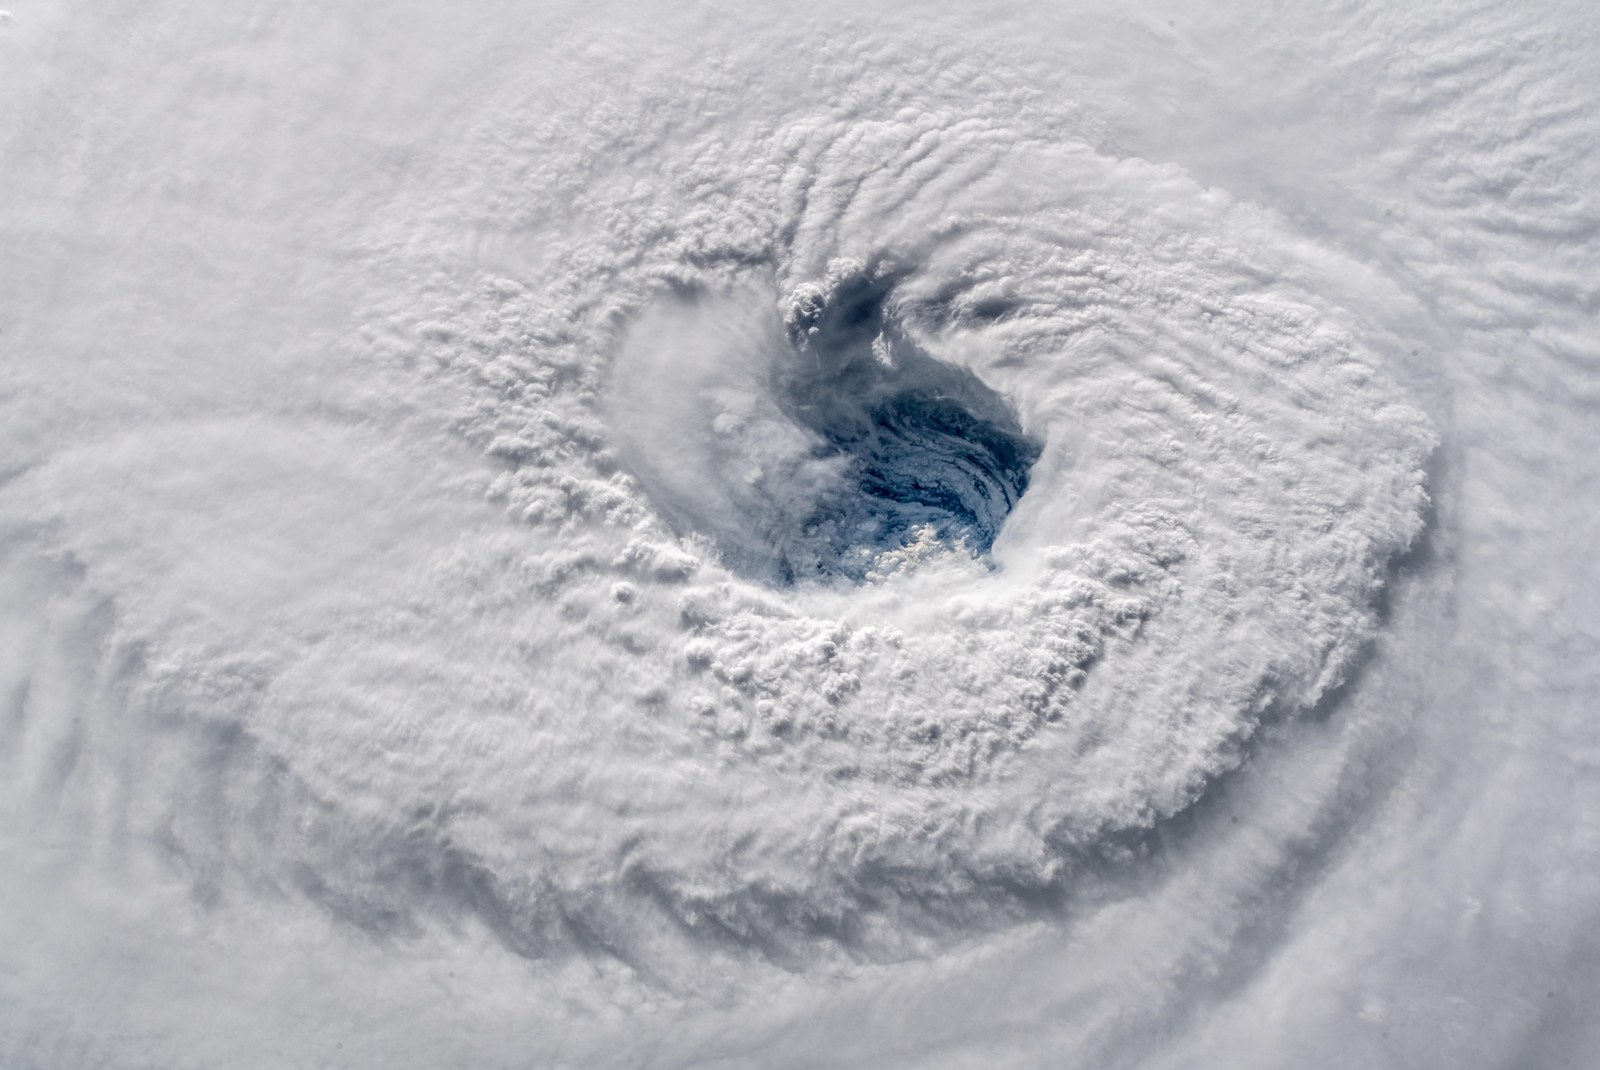 Hurricane Florence’s eye from the International Space Station, 12 September 2018. Photo: Alexander Gerst, ESA/NASA, public domain; resized.
Claim one: the same laws at every scale
Yes. The Navier-Stokes equations describe both, along with the flow in a teacup and the flow around a wing. That is what a law of fluid motion is. But the post concedes the thing that matters in passing, “while the scale and specific driving forces differ,” and then argues past it. The dry ice spins because gas is jetting from under a pellet. The cyclone spins because a planet is rotating under a rising column of air. Both produce spirals because a spiral is what a fluid does when something makes it turn. The shape is shared. The cause is different in each case. One more distinction the post runs together: the superfluid it goes on to propose is not a Navier-Stokes fluid at all. A superfluid has no viscosity, carries its rotation only in quantised threads, and is described by a different set of equations; the clip and the cyclone say nothing about it either way.
This site has a page on exactly this, Recognizing Similarities in the Universe, and the hurricane photographed there sits beside a galaxy for the same reason the post sets a dish beside a storm. Resemblance is a reason to ask, and only that. A hurricane and a galaxy look alike; a hurricane is held together by pressure gradients in air and a galaxy is not. The similarity tells you a question is worth asking. Only the mechanism, worked out and set against a measurement, tells you the answer. The post stops at the resemblance.
Claim two: Bernoulli’s low pressure pulls
The two-balloon demonstration is real physics. Blow a stream of air between two hanging balloons and they swing together, because the faster-moving air between them is at lower pressure than the still air outside, and the outside air pushes them into the gap. Bernoulli’s principle in a sentence: along a streamline, where the fluid moves faster its pressure is lower. The post calls this a pull, and its write-up calls its vortex force “a gravitational-like pull.” This site reads the same demonstration the other way: the balloons are pushed, by the higher pressure outside, and nothing is pulling. We agree on the low pressure and part on the word, and the word is the whole point of Why Pressure.
But look at what the demonstration needs. It needs a flow. Stop blowing and the balloons hang still. The pressure drop between them is $\tfrac{1}{2}\rho v^2$, and for air at 5 metres per second that is 15 pascals; acting over a balloon face of roughly 300 square centimetres that would be about half a newton, an order-of-magnitude figure. At zero flow it is zero. Two planets sitting in a medium at rest, with nothing streaming between them, get nothing from this. To make Bernoulli produce gravity you have to say what is flowing, from where to where, and why it flows toward the centre of every mass. The post’s text does not say. Its write-up does, in an appendix: a line vortex, with a velocity falling as $1/r$, whose Bernoulli low pressure the write-up says gives “a gravitational-like force scaling as $F \propto 1/r^2$.” That can be checked in two lines, and the companion script does it. Bernoulli on a $1/r$ velocity gives a pressure deficit falling as $1/r^2$, so the force from its gradient falls as $1/r^3$, not $1/r^2$; and a line vortex has an axis, so its field is not the same in every direction, where gravity is. One replier asked the plain version of the question, “but why down?” The author answered that it is “in,” toward the centre of mass, which restates what needs explaining. This site’s answer is a different mechanism altogether, and it is written up in What’s Actually Holding Us Down.
At rest, Bernoulli reduces to hydrostatics, and that is a separate path from the balloons: it says nothing about why masses attract, and everything about what a medium does once they do. This site has run that path, and I come back to it below.
Claim three: superfluid vortices and the precession numbers
The 2025 write-up the author links is titled “Superfluid Vortices as a Model for Gravitational Precession.” Its headline result is three pairs of numbers in one sentence of its appendix, and since everything below turns on them, here is that sentence as posted:
Orbital precession was calculated using the angular momentum contribution L = mvr, adjusted for vortex-induced perturbations, resulting in precession rates of 43 arc seconds per century for Venus (observed: 42 arc seconds), 3.8 arc seconds per century for Earth (observed: 5.0 arc seconds), and 1.4 arc seconds per century for Mars (observed: 4.0 arc seconds).
The abstract above it calls this “matching observed data within one, two, and three arc seconds per century, respectively.”
I looked the observed values up. Here they are, tabulated, next to the write-up’s, with general relativity’s prediction computed from each planet’s published orbital elements.
| Planet | GR, computed | Determined (see note) | Write-up: predicted | Write-up: observed |
|---|---|---|---|---|
| Mercury | 42.98 | Messenger-era fits: $\beta - 1 = (-4.1 \pm 7.8) \times 10^{-5}$ | ||
| Venus | 8.62 | 8.6247 ± 0.0005 | 43 | 42 |
| Earth | 3.84 | 3.8387 ± 0.0004 | 3.8 | 5.0 |
| Mars | 1.35 | Mars Reconnaissance Orbiter fits: $\beta - 1 = (0.4 \pm 2.4) \times 10^{-4}$ | 1.4 | 4.0 |
All figures in arcseconds per century. For Mercury and Mars, Will’s 2014 review reports the modern fits as bounds on the post-Newtonian parameter $\beta$ (the precession goes as $(2 + 2\gamma - \beta)/3$ times 42.98, with $\gamma$ taken from Cassini), so those cells show the bound rather than a precession with an error bar. Venus and Earth are the observational column of Table 1 in Biswas and Mani 2008, which credits Venus to a 2007 private communication from Pitjeva and Earth to a 2005 one plus a tabulation by Iorio; those come from ephemeris fits, which already use relativistic equations of motion, so they are consistency determinations at that precision rather than GR-free measurements.
Two things are wrong with the write-up’s numbers, and they are different things. Its “observed” values are not the observed data. Venus’s relativistic precession is 8.6 arcseconds per century, as tabulated from ephemeris fits to Magellan tracking data, and that provenance deserves the same scrutiny I am applying to the post: the paper that tabulates it credits a 2007 private communication from Pitjeva, unpublished at the time, and the value equals GR’s prediction to five figures; Earth’s rests on a 2005 private communication and a published tabulation. They are the best figures I could find, they are not GR-free measurements, and the notes at the end say so. The post’s 42 is off by 33 arcseconds, which is four times the whole effect. Earth’s 5.0 is off by 1.2, and the Mars fits leave no room for anything near 4.0. And its “predicted” values coincide with general relativity’s own, under one wrong label: 43 is Mercury’s precession, the most famous number in the subject, given for Venus; 3.8 and 1.4 are GR’s Earth and Mars values under the right names. The write-up says these came from modified Navier-Stokes equations; I can only report that they are GR’s numbers to the precision quoted. So the “match within one arcsecond” is a match between a textbook value under the wrong planet and a figure that is not a measurement. The write-up says the remaining discrepancies “may stem from variations in vortex speed” and could be tuned. Tuning cannot rescue this, because the targets it would be tuned toward are not the measured precessions.
The write-up’s only numerical comparison with data rests on these three pairs, and once the observed values are corrected, there is no evidence in it that superfluid vortices reproduce planetary precession.
What a fluid actually does when you fit it to the measurements
Here is the part the post never reaches, and the reason I wanted to write this. What follows is a status report on the one version of a fluid medium that can be computed, not a test of the post’s claim that a fluid causes gravity, and I try to keep that line visible throughout. Two different claims hide inside “liquid gravity.” The first is that a fluid causes the attraction: that pressure or flow in the medium is why the apple falls. The second is that, whatever causes the attraction, the medium is a fluid and clocks and light are waves in it. The post asserts the first and never computes it. The second can be computed, and this site did, on 14 September, as the twenty-ninth calculation of its Mechanical Relativity Program. What follows is that calculation, and it is important to say up front what it assumes: the model puts the Newtonian potential of the Sun or the Earth in by hand. The fluid does not produce the attraction here. It responds to it.
The setup is Bernoulli’s principle for a fluid at rest, which is hydrostatics: a compressible medium with a pressure that depends on its density, sitting in that potential, settles so that its pressure gradient balances it. That fixes how the medium’s sound speed varies with height, once you choose how pressure depends on density. The model then adds a postulate, and the record labels it as one: a clock is a standing wave in that medium, so its tick rate follows the local sound speed. Real atomic clocks are not acoustic standing waves, and nothing here derives that identification from atomic physics; it is the rule under which the fit is made. The medium in question is the one that carries light in this model, so its signal speed is light’s speed, and the same rule that sets the clock sets the refractive index light sees. That is the second postulate, and the record states a conflict with it up front: a barotropic fluid has no shear stiffness and so cannot carry transverse waves, which is what light is, a point the same program had already made against an earlier medium before this calculation was run. The calculation goes ahead on the postulate anyway, and what it shows is that even granting it, the light comes out wrong. With those in place the model has one free number, the medium’s compressibility, and this site fixed it once, to the first-order clock formula the Pound-Rebka tower experiment confirms.
It holds, for clocks, by that one fit, and it is worth being exact about how little that shows, and about what the fit had to be. The compressibility that reproduces the clock formula makes the medium a fluid of a kind no laboratory has: its sound speed falls as its density rises, which no laboratory fluid does, and its pressure saturates toward a ceiling; the record calls it admissible and exotic. This is a model that holds by fit, on a postulate already in conflict with the record, and the record does not let it be called more than that. Once a clock’s rate is tied to a sound speed that is itself tied to the Newtonian potential, the clock shift is proportional to the potential difference, and one amplitude fitted at 22.5 metres reproduces the whole family of weak-field redshift results by construction: the Pound-Snider band, the gravitational part of the GPS clock correction, the 1/r fall-off with altitude. The shape is inherited from the potential that was assumed, and the amplitude is the number that was fitted. The shape is shared by any model that ties clock rate to the Newtonian potential; the amplitude is where they differ, and general relativity predicted it from the equivalence principle in 1911 where this model fits it. So the clock rows are a calibration, and the record says so. The test comes next.
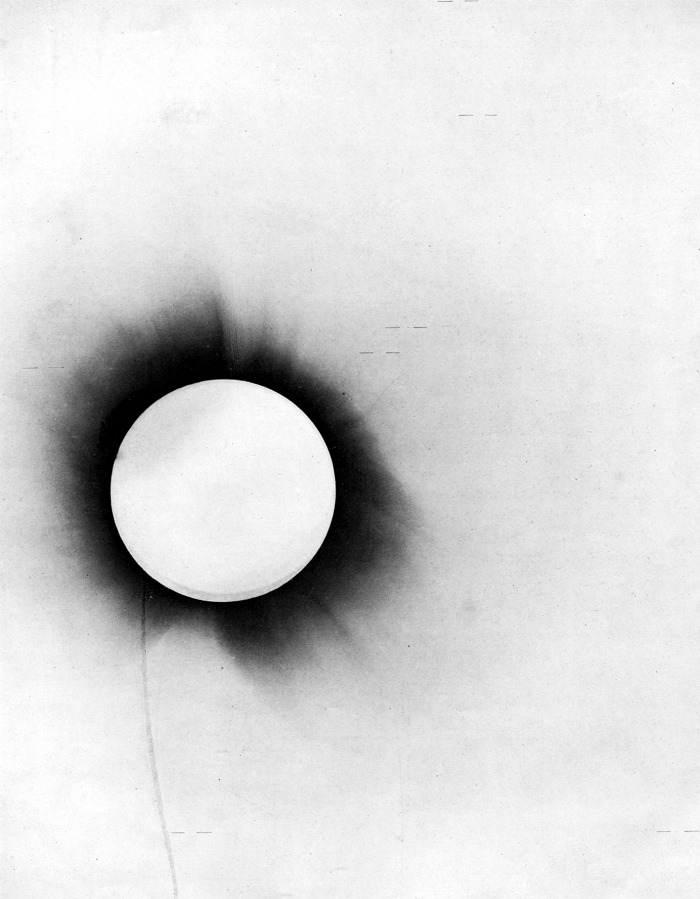 One of the 1919 eclipse plates from Dyson, Eddington and Davidson’s report, the stars whose positions were measured marked with lines. Public domain; unaltered.
Then you ask the same medium about light, and the model has to answer. A medium whose sound speed varies with height is a medium with a refractive index that varies with height, and light passing the Sun through it must bend. The bending and the clock shift are one assumption, read two ways, and once the clock rule is chosen there is no number left to adjust. The model bends starlight at the solar limb by 0.876 arcseconds. The 1919 eclipse measured 1.98 with a probable error of 0.12, about 0.18 at one standard deviation; general relativity’s 1.75 is itself 1.3 of those from the eclipse value, so the eclipse is the historical test and the decisive one is the spacecraft measurement below. The fluid gives half of the modern GR value, to the precision of the integral. In the standard test framework the bending is $(1+\gamma)/2$ times GR’s, so half means $\gamma = 0$. The Cassini spacecraft’s radio-tracking measurement, published in 2003, put $\gamma - 1$ at $(2.1 \pm 2.3) \times 10^{-5}$. Under that map the fluid is excluded by some tens of thousands of Cassini’s standard deviations; the script prints 43,479.
That factor of two is Einstein’s own. In 1911 he computed light bending from the equivalence principle alone, treating gravity as a change in the speed of light, and got 0.83 arcseconds with the solar constants of the day. In 1915 the completed theory doubled it, and in modern terms half the bending comes from the clock effect and half from space itself being curved. A scalar fluid pressure, a single number at each point on a flat background, can supply the clock half. It has no way to supply both halves from one sound speed. That is the whole finding for this class of model. The refractive-index reading of gravity itself is old: Eddington used it in his 1920 book Space, Time and Gravitation, and Dicke built a flat-space version in his 1957 paper in Reviews of Modern Physics, “Gravitation without a Principle of Equivalence.” Both wrote an index of $1 + 2GM/rc^2$, twice the clock term, which reproduces the full deflection, and that factor of two is the ruler half put in by hand. A fluid at rest can write that index too, with a different compressibility, but then it doubles the clock shift; from the one sound speed that sets the clock it cannot put the second half in, and that is the difference between their index and this one. This site had that distinction in its own notes before the calculation was run, cited it rather than rediscovering it, and checked the script’s integral against the closed-form result to five parts per million.
The vortex idea got its own run the next two days. The thirty-first and thirty-second calculations asked whether a rotating mass could set the medium turning in a way that reproduces frame-dragging, the small effect Gravity Probe B measured. A vortex can be fitted to the measurement; nothing in the medium picks that vortex out, and the strength it needs is general relativity’s own coupling written in fluid words. The flows that a fluid does pick out on its own, an irrotational vortex and the boundary-layer flows, the thirty-first calculation computed, and they come out with the wrong radial or angular law, ruled out by shape. Quantised vortices in a superfluid, the post’s specific proposal, put all the rotation on thin cores and leave the bulk of the medium irrotational, a point the independent review of that work made, while the fit needs vorticity spread through the vacuum around the mass, and the post never derives a vortex density or a coupling from anything smaller. And when we asked the site’s working model, the one in How It Could Work, the one question with no free number left, how its gravity shows up in the solar system once the medium has a rest frame, it failed on the two preferred-frame parameters of the standard framework, $\alpha_1$ and $\alpha_2$. That model’s bending was fitted to the measured deflection, which puts it at general relativity’s $\gamma = 1$, and it gives gravity no velocity dependence at all, and with those two facts the framework’s own formula forces $\alpha_1 = -4(1+\gamma) = -8$ and $\alpha_2 = -1$. That $\alpha_1$ predicts lunar-range oscillations of 250 to 300 metres; laser ranging to the Moon leaves residuals under a centimetre, four orders of magnitude. That $\alpha_2$ would have swung the Sun’s spin axis through millions of degrees over 4.6 billion years; it sits within 6° of the planets’ plane, which bounds $|\alpha_2|$ below $2.4 \times 10^{-7}$, and pulsar timing pushes the strong-field version below $1.6 \times 10^{-9}$, six to nine orders. The bounds’ papers are in the notes at the end, and the derivation is the one line above. Of these calculations only the twenty-ninth is published, alongside this article; the thirty-first computed the vortex flows, the thirty-second the preferred-frame parameters, and both are in the project’s working notes and summarised here.
What this does and does not exclude. The fluid that fails here is a specific object: a barotropic fluid at rest on a flat background, in a Newtonian potential supplied from outside, with a clock’s rate and light’s speed both tied to its sound speed. That class fails the light by a factor of two, and the site’s working model, fitted to the measured bending, fails the preferred-frame tests by orders of magnitude. It does not touch the post’s first claim, that a fluid causes the attraction, because nothing in it was asked to; and it does not exclude every continuum picture. Analogue gravity, the field that builds acoustic black holes in laboratory fluids, is the steelman a physicist would raise, and this site’s own record raises it: Unruh’s 1981 result, and the Barceló, Liberati and Visser review of it, give sound in a moving fluid a curved effective spacetime. It is a kinematic result. It hands the phonons a metric without handing the fluid GR’s dynamics, and it says nothing about what light sees. A medium that returned $\gamma = 1$ and $\alpha_1 = \alpha_2 = 0$ would need something of that kind, dynamics added and its rest frame hidden from every test that has looked, or an elastic sector the record names and has not built; neither the post nor this site has written one down.
What this project makes of it
The post and this site start from the same picture: a real medium, made of something too small and too fast to have been caught, and forces that are pushes in it. That is where this site stands, as a working preference, and I owe the reader the same sentence I would want from the post: the program’s own numbers do not yet support it. This site’s standing rule is that the physics we have describes the measurements correctly and stops short of saying what physically acts, and agreement with measurement is the pass condition. On gravity, every medium this site has run against the solar-system benchmarks has failed one by a wide margin, and the one that matched the clocks did so by calibration. A reader is entitled to take that run of failures as evidence against the premise itself, and I will not argue them out of it; I hold the premise as a preference, on the record as such, until a model either passes or the list of things a medium cannot be closes over it. Neither the post nor this site has a passing model. The difference is what each does next. The post reasons from resemblance to a conclusion and stops. This site reasons from a postulate to a number, holds the number against a measurement, and writes down the failure with the same care as a pass. On this question the disciplined result so far is a list of things a medium cannot be. Bernoulli’s balloons do not settle it. The Cassini radio measurement, the Moon’s range, and the Sun’s spin axis do, and a medium has to satisfy all of them.
A replier raised the objection that would apply if the post’s flowing medium were real: planets orbiting against the flow would slow and planets orbiting with it would speed up. That is the classical drag objection to Le Sage’s push gravity and to any medium with a rest frame that planets move through, and it is a fair one. This site’s answer is to put numbers on it, in Working Range of Push Gravity and the drag and heating tables behind it, and that account is open too.
Where this leaves it
What this project did: it identified the clip and its exhibit, checked the post’s precession table against the measured values and general relativity’s predictions from published orbital elements, found the observed column wrong and the predicted column mislabelled, separated the post’s two claims, and set the second of them, that clocks and light are waves in a fluid medium, against the calculation this site had already run and now publishes alongside it, while saying plainly that the first, that a fluid causes the attraction, was not tested by it.
Check, re-runnable by anyone: the script is at /models/the-balloon-and-the-planet-v1.py and needs /models/barotropic-medium-gravity-v1.py and /models/how-it-could-work-v1.py in the same folder.
python3 the-balloon-and-the-planet-v1.py --selftest
checks that general relativity’s formula returns Mercury’s 42.98 from the fact-sheet elements, that the write-up’s “Venus 43” equals GR’s Mercury and not GR’s Venus, that the shipped light-bending function agrees with its closed form and gives half of GR, that a medium with its compressibility set to the record’s starting value, which gives no clock shift at all, is caught (the failure path), that Bernoulli’s drop is zero at zero flow, and that the write-up’s vortex gives a force falling as $1/r^3$. Without the flag it prints the table above, the bending numbers, the balloon numbers, and the force law of the write-up’s own vortex, with the sources of the inputs in its header. The bending function is not re-implemented here; the script loads the twenty-ninth calculation’s published file and calls it, so a later change to that file changes this result.
Exactly how: one formula for the precession, $6\pi GM / c^2 a (1-e^2)$ per orbit, scaled by orbits per century; one function call into the shipped medium model for the bending; one line for the balloons; one finite difference for the vortex’s force law.
Compared against the standard: the parametrised post-Newtonian framework is the documented way to test any metric theory of gravity against the solar system. It reduces a theory’s predictions to a handful of numbers, and two of them decide this article. Mercury’s precession tests a combination of $\beta$ and $\gamma$; light bending and the Shapiro delay test $\gamma$ alone. The post’s superfluid makes no PPN prediction, because nothing in it is specified well enough to compute one. This site’s models do: the barotropic fluid of the published script gives $\gamma = 0$, and the working model’s gravity sector gives $\alpha_1 = -8$ and $\alpha_2 = -1$, and those are the numbers that exclude each. The same bar applies to both: a proposal that cannot produce PPN parameters is not yet a theory of gravity, and one that produces failing ones is excluded until it is revised. Where this site conforms to the standard is in producing the numbers at all and reporting the exclusion. Where it does not conform is in two places: it has no medium model that passes, and says so; and the preferred-frame numbers come from calculations in its working notes that are not yet published to the re-runnable standard the twenty-ninth meets, which is stated wherever they appear. The table below uses the classification of this site’s catalog pages.
| Claim | Status here | On what evidence |
|---|---|---|
| Dry-ice spirals and cyclones are both flow patterns described by Navier-Stokes | Proven | Textbook fluid mechanics; the drivers differ (sublimation jets; Coriolis), and nothing about gravity follows |
| Two balloons move together when air is blown between them, the outside air pushing them into the low-pressure gap | Proven | Textbook demonstration; needs a flow, $\tfrac{1}{2}\rho v^2$, zero at rest |
| Superfluid vortices reproduce planetary precession | Fringe, unsupported as presented | The only quantitative claim rests on a table whose observed column is not the observed data and whose predicted column is GR’s own values, one mislabelled |
| A barotropic medium at rest in a given Newtonian potential, clocks and light tied to its sound speed | Disproven, as implemented | This site’s own twenty-ninth calculation: clocks matched by one fitted amplitude (a calibration, not a test); light bent at half of GR, $\gamma = 0$ against Cassini’s $\gamma - 1 = (2.1 \pm 2.3) \times 10^{-5}$ |
| The working model’s gravity sector, with no velocity dependence, once the medium has a rest frame | Disproven, as implemented | Thirty-second calculation, in the working notes and not yet published as a script: $\alpha_1 = -8$ and $\alpha_2 = -1$ follow in one line from $\gamma = 1$ and no velocity term (the derivation is in the body), against lunar ranging and the Sun’s spin axis, four and six to nine orders of magnitude |
Notes on sources, and how firm each claim is
The post is x.com/slave_2_liberty/status/2102289526307652057 (22 September 2026); its clip is credited on screen to @mathjoyhunter; the 2025 write-up is x.com/slave_2_liberty/status/1959675672391291224. Icy Bodies: Shawn Lani’s own studio page, read; the Exploratorium’s exhibit page refused the fetch, so its description is known here only through search summaries. Mercury and Mars: Will, Living Reviews in Relativity 17, 4 (2014), equation 65 and the Messenger and Mars Reconnaissance Orbiter bounds on $\beta$ beneath it, read from the arXiv PDF. Venus and Earth: Biswas and Mani, Central European Journal of Physics 6, 754 (2008), arXiv:0802.0176, Table 1, read from the paper’s PDF; the paper itself presents an alternative model and reports agreement with both GR and the observations. Mercury and Mars: general relativity’s values are computed here; the measured agreement is quoted as Will reports it, as bounds on $\beta$, because no source I read prints either as a precession with an error bar. Venus and Earth: the paper’s Table 1 is a comparison table in a paper presenting an alternative model; its observational column is used here because it names its sources, and the caveat that ephemeris fits assume relativistic equations of motion is stated in the body. Orbital elements from the NASA Planetary Fact Sheet. The 1919 deflection: Dyson, Eddington and Davidson, Philosophical Transactions A 220, 291 (1920), Sobral 4-inch plates, 1.98 ± 0.12 probable error, which is about ± 0.18 at one standard deviation. Eddington 1920: Space, Time and Gravitation, the optical-analogy treatment of light bending. Dicke 1957: Reviews of Modern Physics 29, 363, a flat-space variable-speed-of-light formulation with an index of refraction. Both characterised from secondary accounts and the project’s own notes, not re-read for this article. The preferred-frame bounds: Müller, Nordtvedt and Vokrouhlický, Physical Review D 54, R5927 (1996) for the lunar-range amplitudes; Nordtvedt, Astrophysical Journal 320, 871 (1987) for the Sun’s spin axis; the pulsar bound and the PPN forms as tabulated in Will 2014; the model’s $\alpha_1 = -8$, $\alpha_2 = -1$ from the thirty-second calculation’s script, revision 2, in the project’s working notes. Cassini: Bertotti, Iess and Tortora, Nature 425, 374 (2003). Einstein 1911: Annalen der Physik 35, 898. The twenty-ninth through thirty-second calculations are this site’s own, run 14 to 16 September 2026, each reviewed independently before its result was recorded; their scripts and outputs are in the project’s working notes and the twenty-ninth is published here. Firmest: the measured precessions, the bending measurements, and the arithmetic of the table. Least firm: my reading of the write-up’s intent, which is an inference from its numbers. Which claims the script closes: the GR precession values, the bending ratio, and the Bernoulli figures. Which depend on the literature: every measured value in the table, the Cassini bound, and the preferred-frame bounds.